Creating a system you love shouldn't be difficult. The Acoustic Frontiers blog is here to help.

This article is intended to provide an overview of room acoustic measurements and how they are used to evaluate the extent to which your room is causing acoustic distortions that are degrading your sound quality.
The key questions answered are:
The first is the frequency response, which is a plot of energy in decibels (dB) against frequency in Hz. Most of us should be familiar with these as they are often displayed in equipment reviews. An example of a frequency response measurement taken with XTZ Room Analyzer II Pro is shown below. Response variations of +/-10db through the bass region below 300hz are clearly visible. A +10db difference is roughly equivalent to someone perceiving the sound as being twice as loud.

Bass frequency response, 1/12th octave resolution, from XTZ Room Analyzer II Pro
It’s useful to look at the frequency response at different levels of resolution. Smoothing, in the form of a moving average filter, is applied to the measurements. Typical filters are 1/3rd octave and 1/12th octave. In the mid and high frequencies the ear perceives loudness at 1/3rd to 1/6th resolution, hence why highly smoothed measurements are often used.

Same measurement, 1/3rd vs. 1/12th smoothed frequency response, from Room EQ Wizard
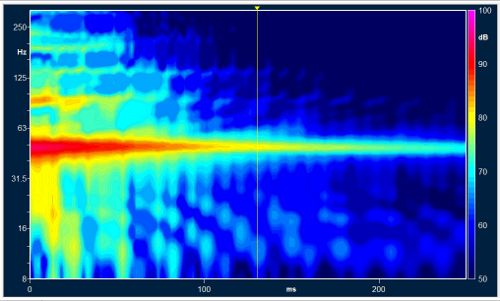
The second is a combination measurement, which shows time, energy and frequency (TEF) all together. There are many ways to look at these measurements, one is the waterfall diagram, another is a cumulative spectral decay (CSD) diagram. Structural resonances such as a vibrating floor and slowly decaying room modes can be very quickly identified from this measurement. The following is a CSD plot in the form of a sonogram or 2D Waterfall taken with XTZ Room Analyzer II Pro. The two axes are time and frequency. The data plotted is the measured level of the sound in dB. Bass frequencies take longer to decay than other parts of the frequency range and that the decay of sound is often uneven due to room modes. Evidence of a room related resonance at 50Hz can be clearly seen in the measurement below.

Spectrogram, from XTZ Room Analyzer II Pro

Waterfall plot, of a well treated room, showing a structural resonance at 23Hz and a slight amount of room mode activity at 35Hz.
The third measurement looks at how long it takes for mid and high frequency energy to decay in the room. There are two main forms that this measurement takes.
One is a single figure measurement, often called T60. Because it is quite difficult in real world situations to record the time taken for a signal to decay the full 60dB (due to high noise floor or low measurement level) T30 is often used as a proxy. T30 is the 60dB decay time calculated by a line fit to the portion of the decay curve between -5 and -35dB. Note that we drop the ‘R’ from the front of the time decay measurements in small rooms since there is no reverberant field (R stands for reverberation). In a small room T60 can’t tell us much more than whether the room is overly live or dead.
The second, and much more useful for our purposes, is a measurement that shows the decay time over different octave or one third octave frequency bands. It is important for decay time to be consistent across the spectrum to preserve balanced reproduction. The following chart is an example of a 6 band measurement from XTZ Room Analyzer II Pro that shows unbalanced decay times across the frequency spectrum.

One octave T60 measurements, from XTZ Room Analyzer II Pro
It is also possible to look at the same information as a line graph. The following graphic shows T20, T30 and T60 on the same graph. T20 is very similar to T30, except the extrapolated figure is based on a form fit to the decay curve between -5 and -25dB.

T20, T30, T60, from Room EQ Wizard
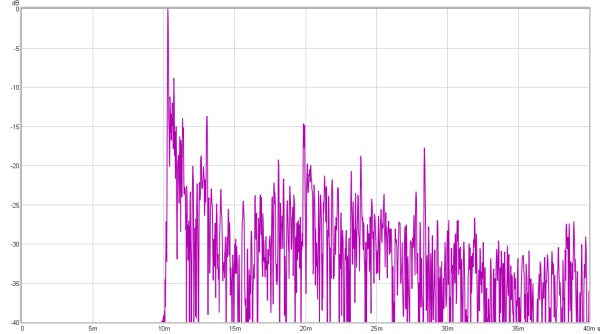
The final major measurement type is the energy time curve (ETC), which is a plot of amplitude in dB against time (typically measured in milliseconds). An energy time curve shows how sound energy decays in a room. From an analysis of the energy time curve much can be deduced, including the level of reflections relative to the direct sound and the time it takes for sound to decay within the room.
Zero on the time axis, and the highest peak on the magnitude axis, represents the direct sound from the speaker. The plot below shows how level changes over time, with each peak being due to a reflection from a nearby boundary such as the floor, ceiling or side walls. This clearly shows that there are a large number of reflections in a typical listening room and that sound does not always decay evenly.

Energy time curve, from Room EQ Wizard
A very important point to remember is that ETCs are spectrally blind (i.e. they contain no information as to the spectral content of the reflected sound). There are unfortunately a lot of standards around that mandate such things as “no peak above -10dB”. We strongly recommend to not use such standards; in fact much modern psychoacoustic work finds that people enjoy listening environments that have high levels of reflections. In our opinion the most critical thing is that the spectral content of the reflected sound be similar to the direct sound. For more read our article listening room reflections and the ETC.
To take a set of acoustic measurements you will need the right tool. These articles cover the different options available and run through the process of taking the key measurements for a couple of the popular standalone software products.
From the Acoustic Frontiers blog:
Nyal Mellor, our founder, co-authored this article with Ethan Winer of RealTraps:
Once you have a set of acoustic measurements you need to analyze them to figure out the areas where your room meets standards and the areas it does not.
Acoustic Frontiers and HdAcoustics have published a white paper on this subject (warning, it is quite in depth!).
Also see our article on How to Buy the Right Acoustic Panels. If you need help we do offer a Room Acoustic Analysis service.
This case study highlights how Acoustic Frontiers engineered a high-performance home recording studio capable of supporting DJ performance, electronic production, mixing, and mastering—without compromising accuracy or workflow.
Learn how early home theater design, layout, and acoustic treatment improve performance in new home construction.
This media room was intentionally designed to feel like part of the home—not a separate, tech-heavy space. Through careful acoustic planning, equipment integration, and final calibration, we achieved a room that is both beautiful to live in and immersive to experience.

Nyal Mellor, Founder, Acoustic Frontiers


Nyal Mellor
Author